Stop drowning in spreadsheets. DividendsIQ scores about 20,000 stocks across the US, Euronext, and Tel Aviv (TASE) - with native shekel, euro, and dollar tracking few other tools offer - then lets AI turn the data into a plain-English verdict.
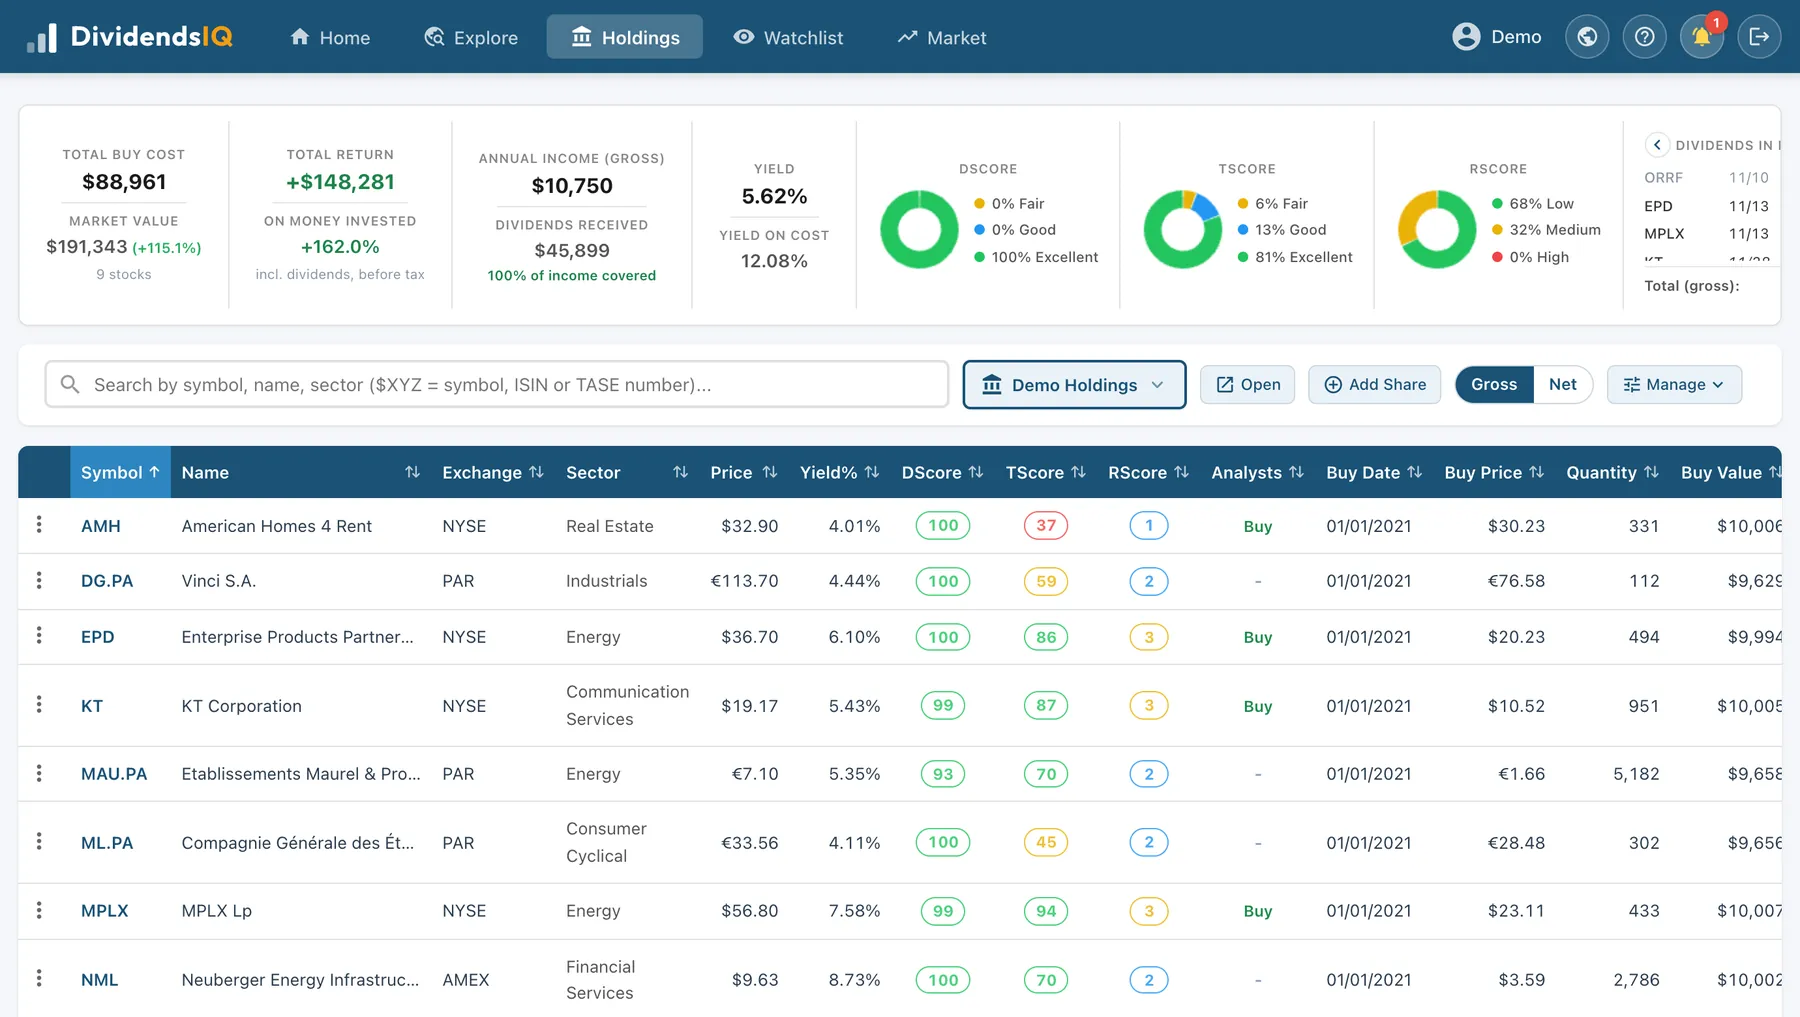
No mock-ups: these are the screens you get, shown with the demo's example portfolio. Click a picture to see the whole screen.
Every stock gets a consistent, quantitative scorecard - so you can compare apples to apples across about 20,000 stocks.
Stability, consistency, and growth of the dividend over time. Spots the aristocrats, flags the at-risk payers.
How steadily the price has climbed over 5 years, recent years counting more. Spots steady risers, and flags the fallers behind many yield traps.
Financial health, leverage, and vulnerabilities. Ensures the payouts you count on are actually sustainable.
Is the dividend really earned? The right test depends on what you own. DividendsIQ runs it for you and shows one Dividend Coverage number.
Whether you invest in US blue chips, European payers, or Israeli dividend stocks - DividendsIQ scores them all consistently and tracks your portfolio in the currency that makes sense for you.
US-listed dividend aristocrats, REITs, and ETFs - the deepest dividend universe, fully scored.
Paris, Amsterdam, Brussels, Lisbon, Dublin, Oslo - European dividend payers with EUR-denominated income.
Israeli equities and dividend stocks tracked in shekels - a local market rarely covered by global screeners.
Forget jumping between five websites for research. DividendsIQ generates fresh, dividend-focused analysis for any ticker - in seconds - using Claude AI.
The fast take: is this a good, mixed or risky dividend holding, and why. The best place to start before you dig into the detail.
Plain-English overview: what the company does, how it makes money, and where it sits in its sector.
Bullet-point snapshot - key figures, moat, growth drivers, and the dividend story at a glance.
Is this stock a compounder, a high-yield play, or a turnaround? AI frames the thesis for dividend investors.
Cheap, fair, or expensive? Compares the price to sector peers, fair-value anchors and quality - so the recommendation has an economic meaning.
Price trend, momentum, support & resistance - distilled into a readable narrative, not a wall of indicators.
For funds: what the fund holds, how concentrated it is, and how its price compares with the value of what it owns (NAV).
Revenue, margins and earnings - annual and quarterly - summarized in plain language, not accounting-speak.
Assets, debt and equity: how solid the balance sheet is, and what it means for payout safety.
Operating, investing and financing cash - is the dividend covered by real cash, not just earnings?
The biggest recent stories (up to 5) and how each could affect the price, the dividend or its coverage. US stocks.
Generate once, re-read anytime. Re-generate when you want the freshest analysis. No wait, no boilerplate.
Every report is tuned for dividend investors - payout sustainability, growth, risk. Not generic equity research.
A focused, browsable home for the AI reports across DividendsIQ. Sign in, search any company, and read its latest verdict and deep-dive analysis - then share a report link that anyone can open, no account needed to read it.
From the first screen to the final scorecard, DividendsIQ turns research, tracking, and monitoring into a single streamlined workflow.
Search any stock, see your lists with live prices and scores, upcoming dividends, a world markets ticker, and the top-scored and top-yielding stocks.
On the Explore page, set yield, market, and score thresholds - then describe what you want in plain English ("moderate-risk dividend growers with momentum") and let AI do the screening.
Up to 5 stocks side by side: yield, coverage, scores, total return and analyst targets, with charts of price and dividend growth. Save it to open later.
Each list's total return, dividends received and coming month by month, how much income is covered, 5-year forecasts, sectors and scores.
What is strong, weak or at risk in a list: covered and regular income, where it comes from, concentration, weak spots and the latest news. Facts, not guesses.
Set a dividend target, a gain target or an amount to invest, plus your own rules. See the stocks that fit and what the plan brings by your target year. Not advice.
Every buy, sell, fee and dividend in one place. Import your bank's file, see your real return after tax and fees, and export to Excel.
Your payments month by month: received, coming, and expected in later years - for one list or several together.
Set your tax rules (Israel, US, tax-free or your own) and switch any page between dividends before and after tax. Each list can have its own currency and rules.
Eleven alert types - price, yield, scores, new dividends, earnings, payout safety, major news and more - by email and push, for a stock, a list or everything.
A short weekly look at the markets in plain English: indices, interest rates, economic news and notable dividends, with colored signals. No tips.
One view for every stock: scores, analyst rating, yield history, price trend, financials and years of dividends paid. On a phone, swipe to the next stock.
Track stocks before you buy: compare them, chart them, set alerts and read the AI analysis.
A short tour on every page and tool, from the Help menu. It runs on example stocks, so nothing of yours is touched.
The proprietary DScore, dividend calendar, and yield analysis are designed for income investors - but several DividendsIQ tools work just as well for any equity strategy: value, growth, or core holdings.
The verdict, valuation, technical analysis, financial statements and news reports work for any stock you research, dividend-paying or not.
Several portfolios with total return, sector mix, score donuts and 5-year forecasts - for any stock, not just dividend names.
Every buy and sell with your average cost, gains from sales and on paper, and your return after tax and fees - whatever you invest in.
Spot concentration, sector bets, weak spots, analyst targets and the latest news in any list.
Put any 5 stocks side by side on price, total return, scores, valuation and risk.
Price, daily move, score, analyst rating, earnings and major news alerts work for any stock.
A consistent research view for every listed stock - financials, momentum and AI analysis. Mix dividend names with value or growth picks.
The week's markets, interest rates and economic news in plain English - useful whatever you invest in.
Traditional screeners give you raw columns. DividendsIQ gives you a quantitative framework and an AI that understands how you want to invest.
"High-yield dividend aristocrats with strong balance sheets" - natural language, not checkboxes.
Scored, ranked, and ready. Every candidate comes with its D/T/R scorecard and full metrics.
Add to your Holdings, monitor the dashboard, and get alerts the moment something matters.
Short, practical guides built around real examples - from how dividends get paid to taxes and retirement income.
Free to start - no credit card required, and $1 of free Balance to try the AI reports. Open the app or create your account in under a minute.